Monitoring with Grafana
Guide to using Grafana and CloudWatch
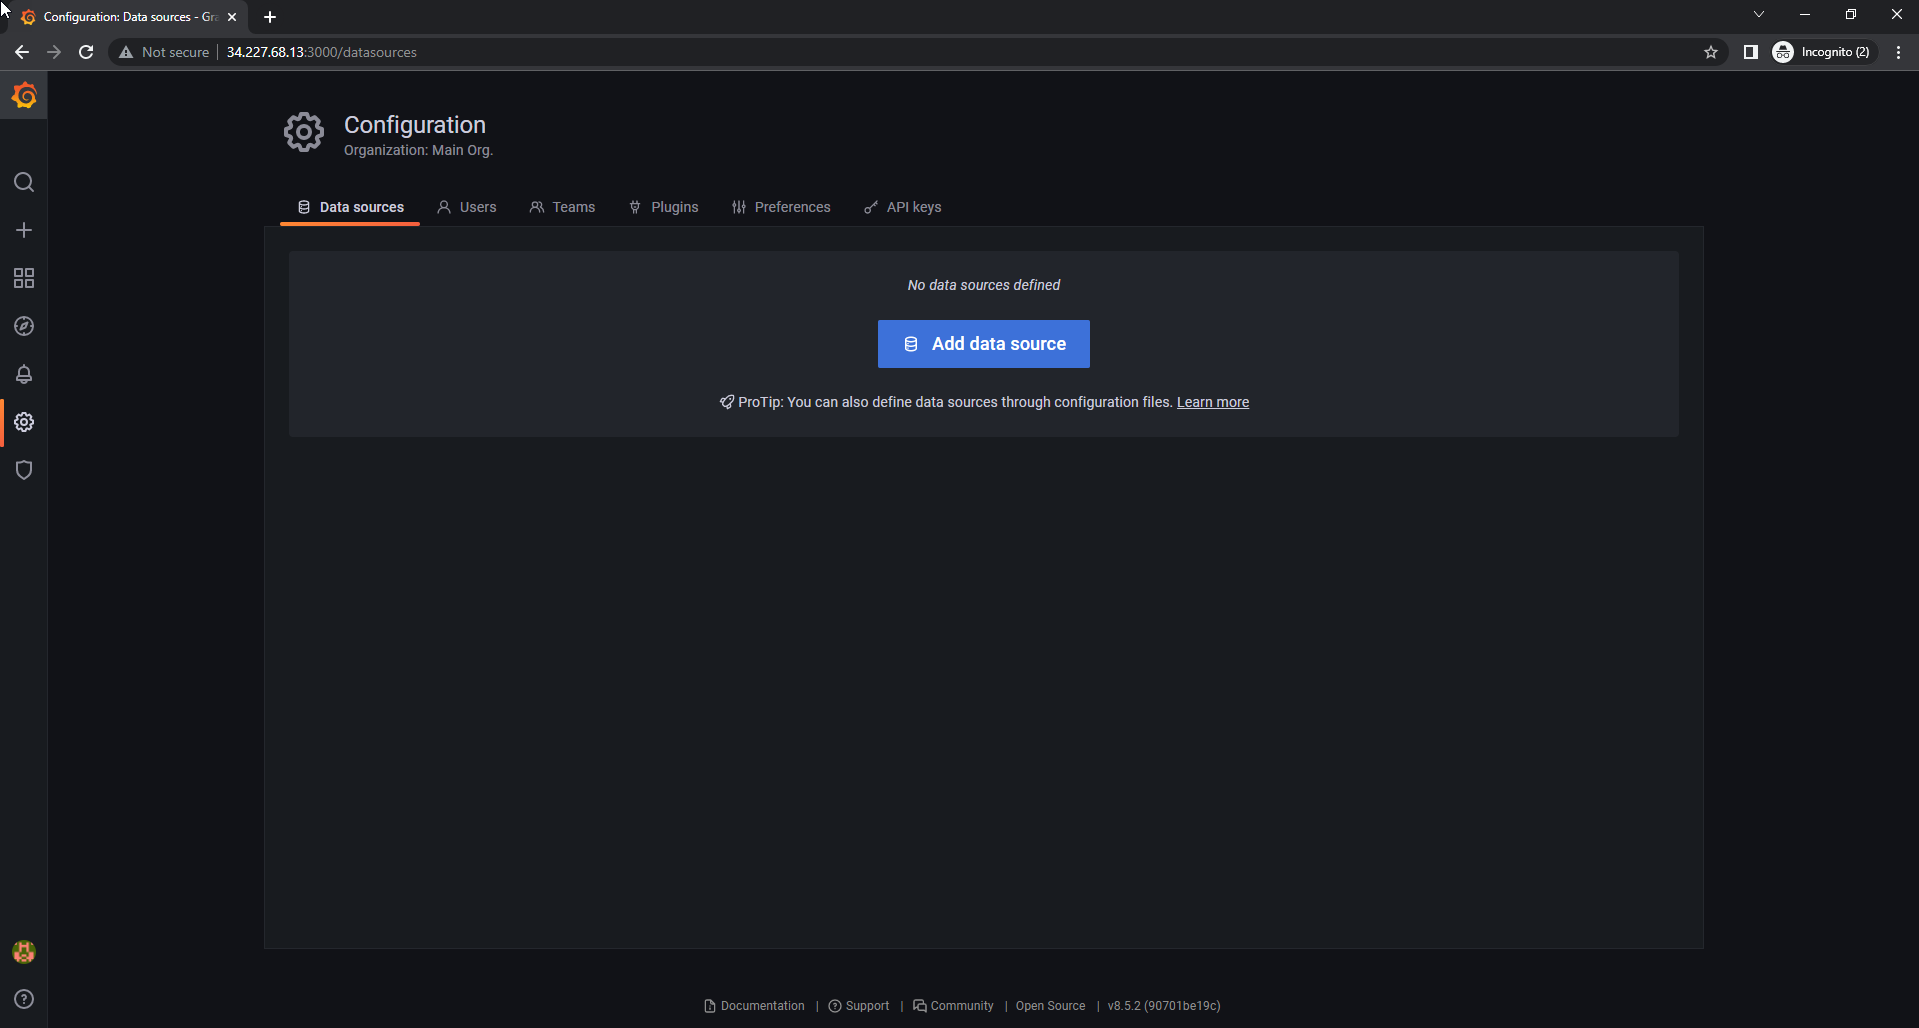
In the Grafana interface:
- Select Connections.
- Select Data sources.
- Select Add data source.
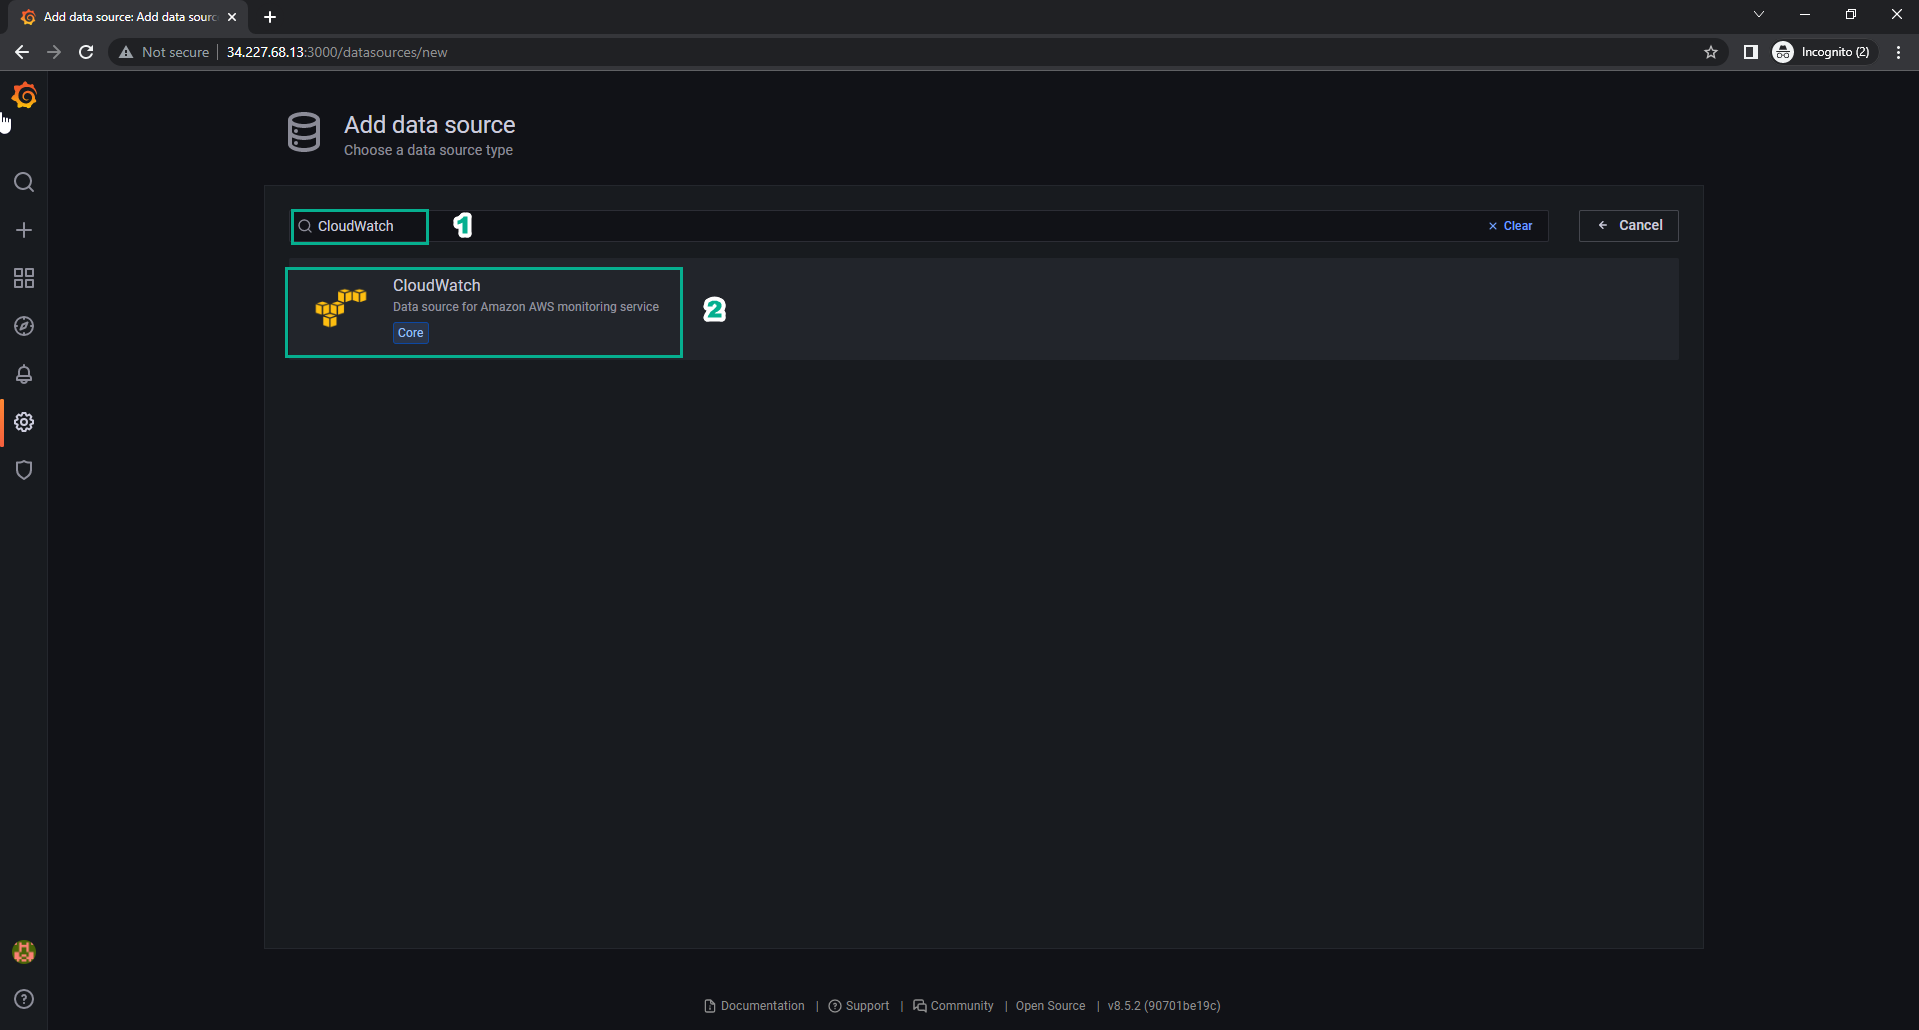
In the Add data source interface:
- Find CloudWatch.
- Select CloudWatch.
In the Data Sources interface:
- In the Name field, enter
cloudwatch. - In the Connection Details section, at Authentication Provider, select Access & secret key.
- Access Key ID, enter the access key id of IAM user.
- Secret Access Key, enter the secret access key of the IAM user.
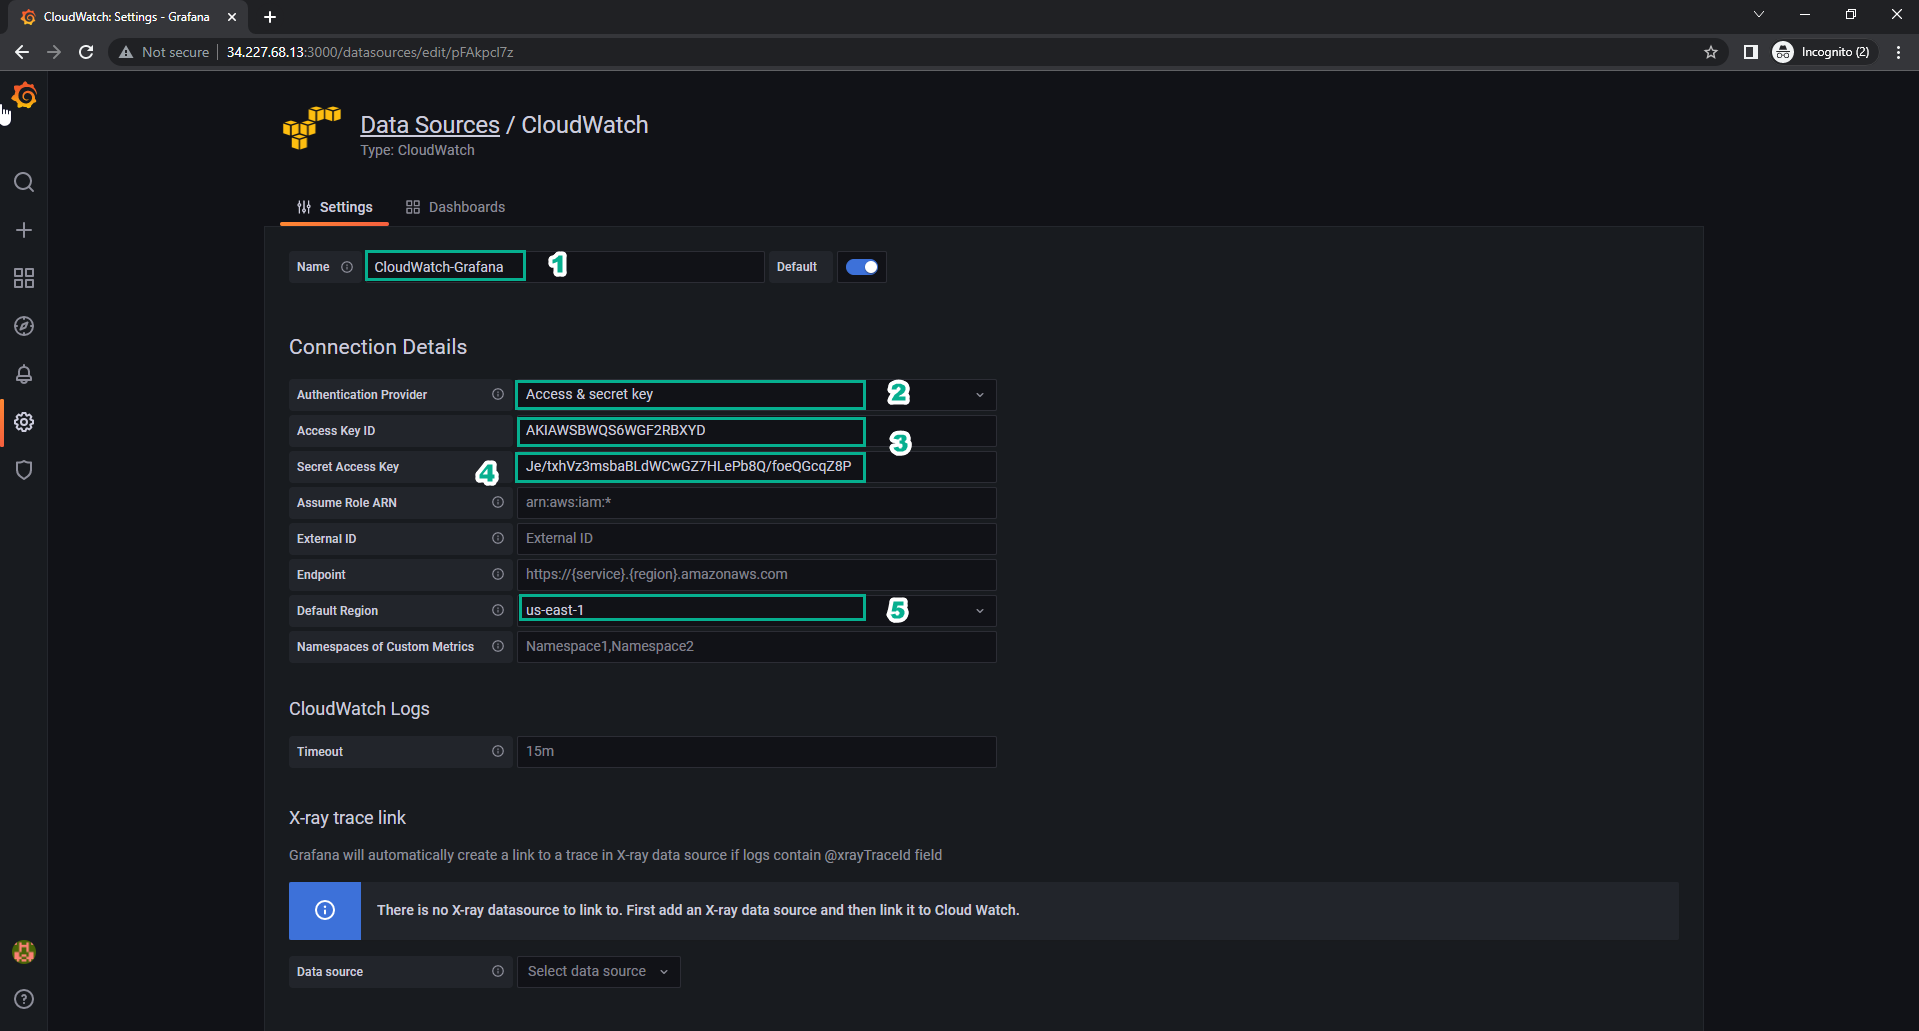
- Select Region ap-southeast-1.
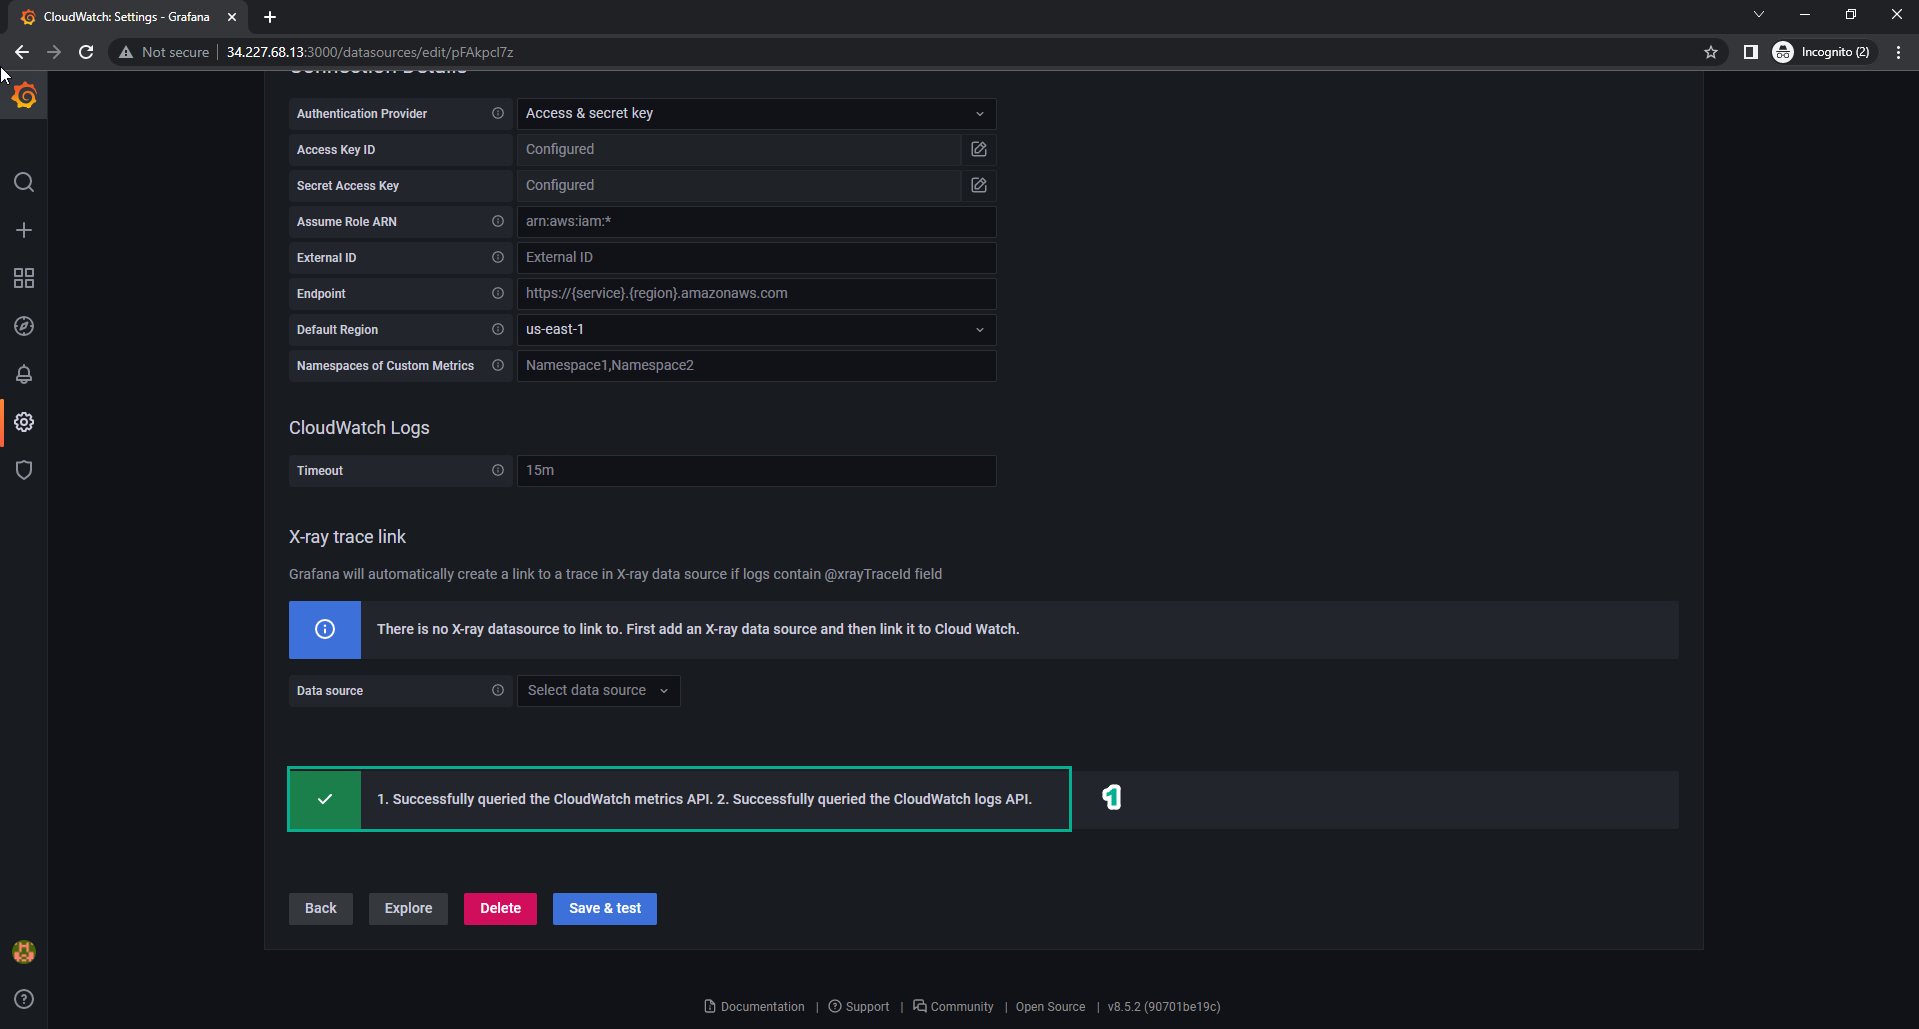
- In the Name field, enter
Select Save & test.
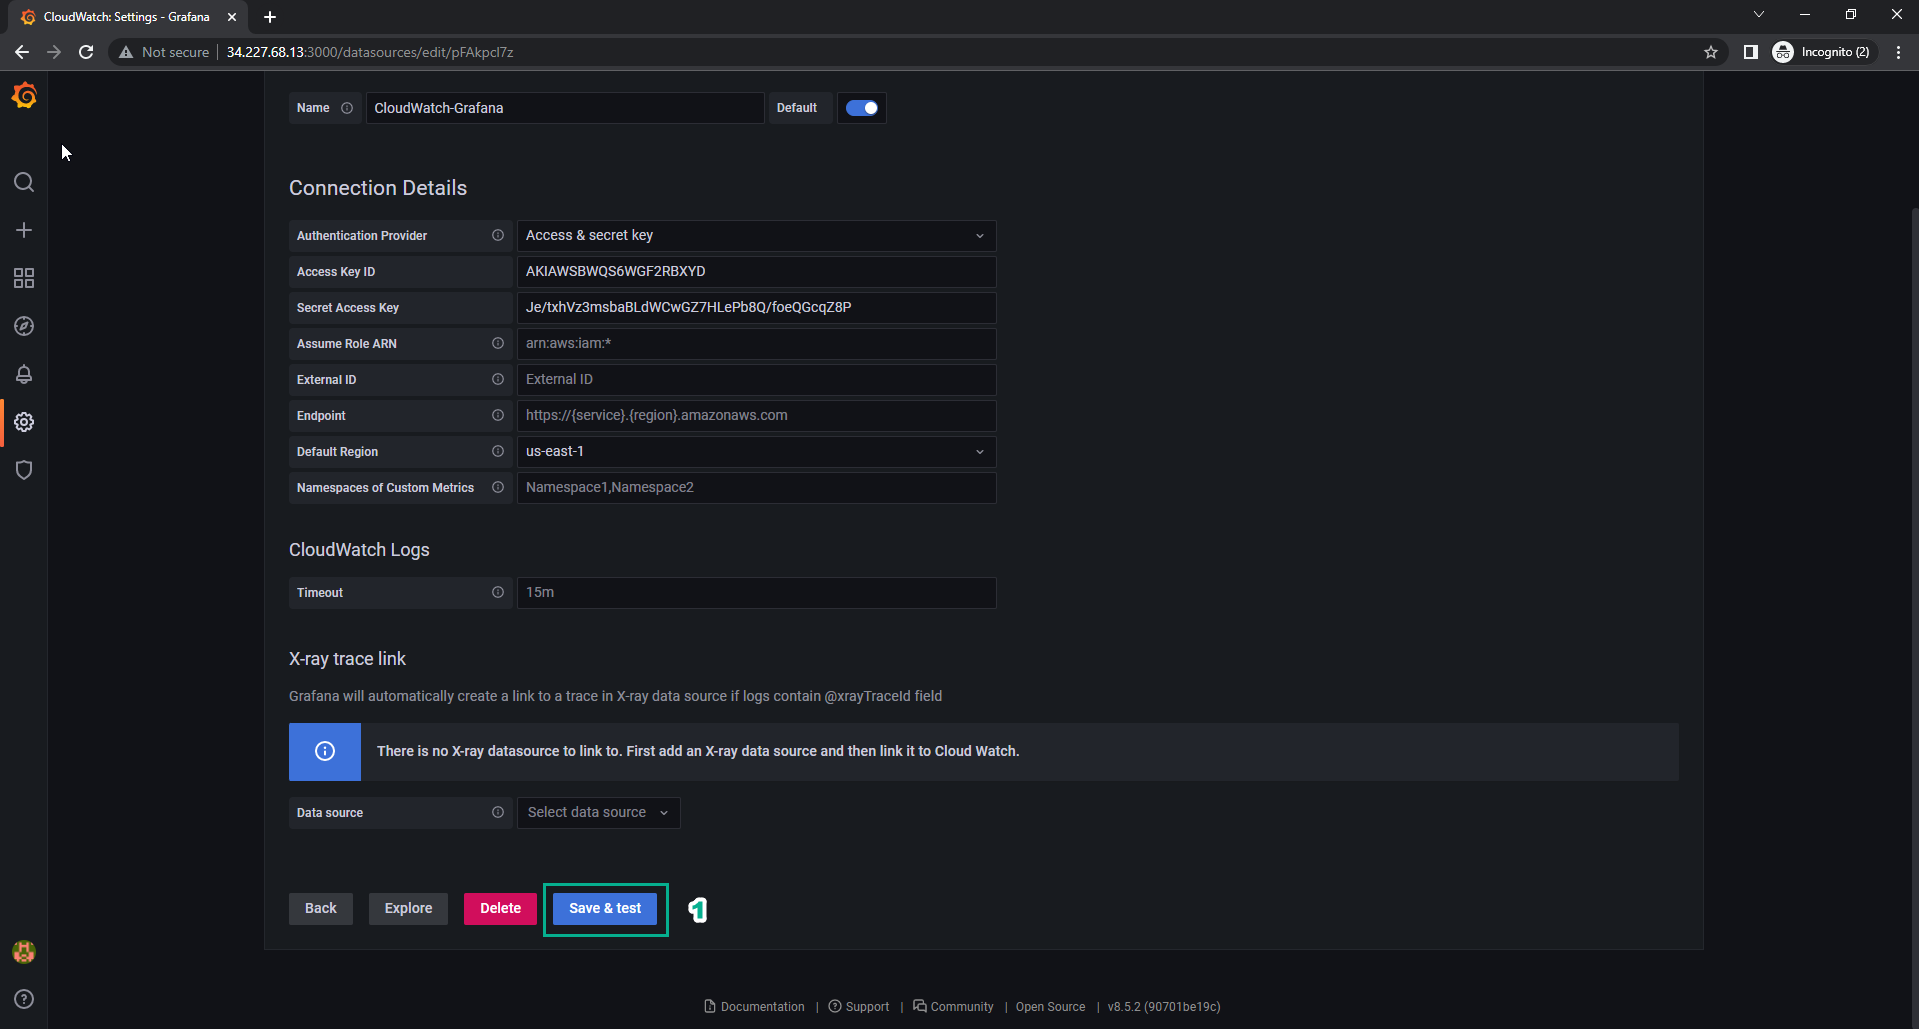
When connected successfully, you can query data from CloudWatch.
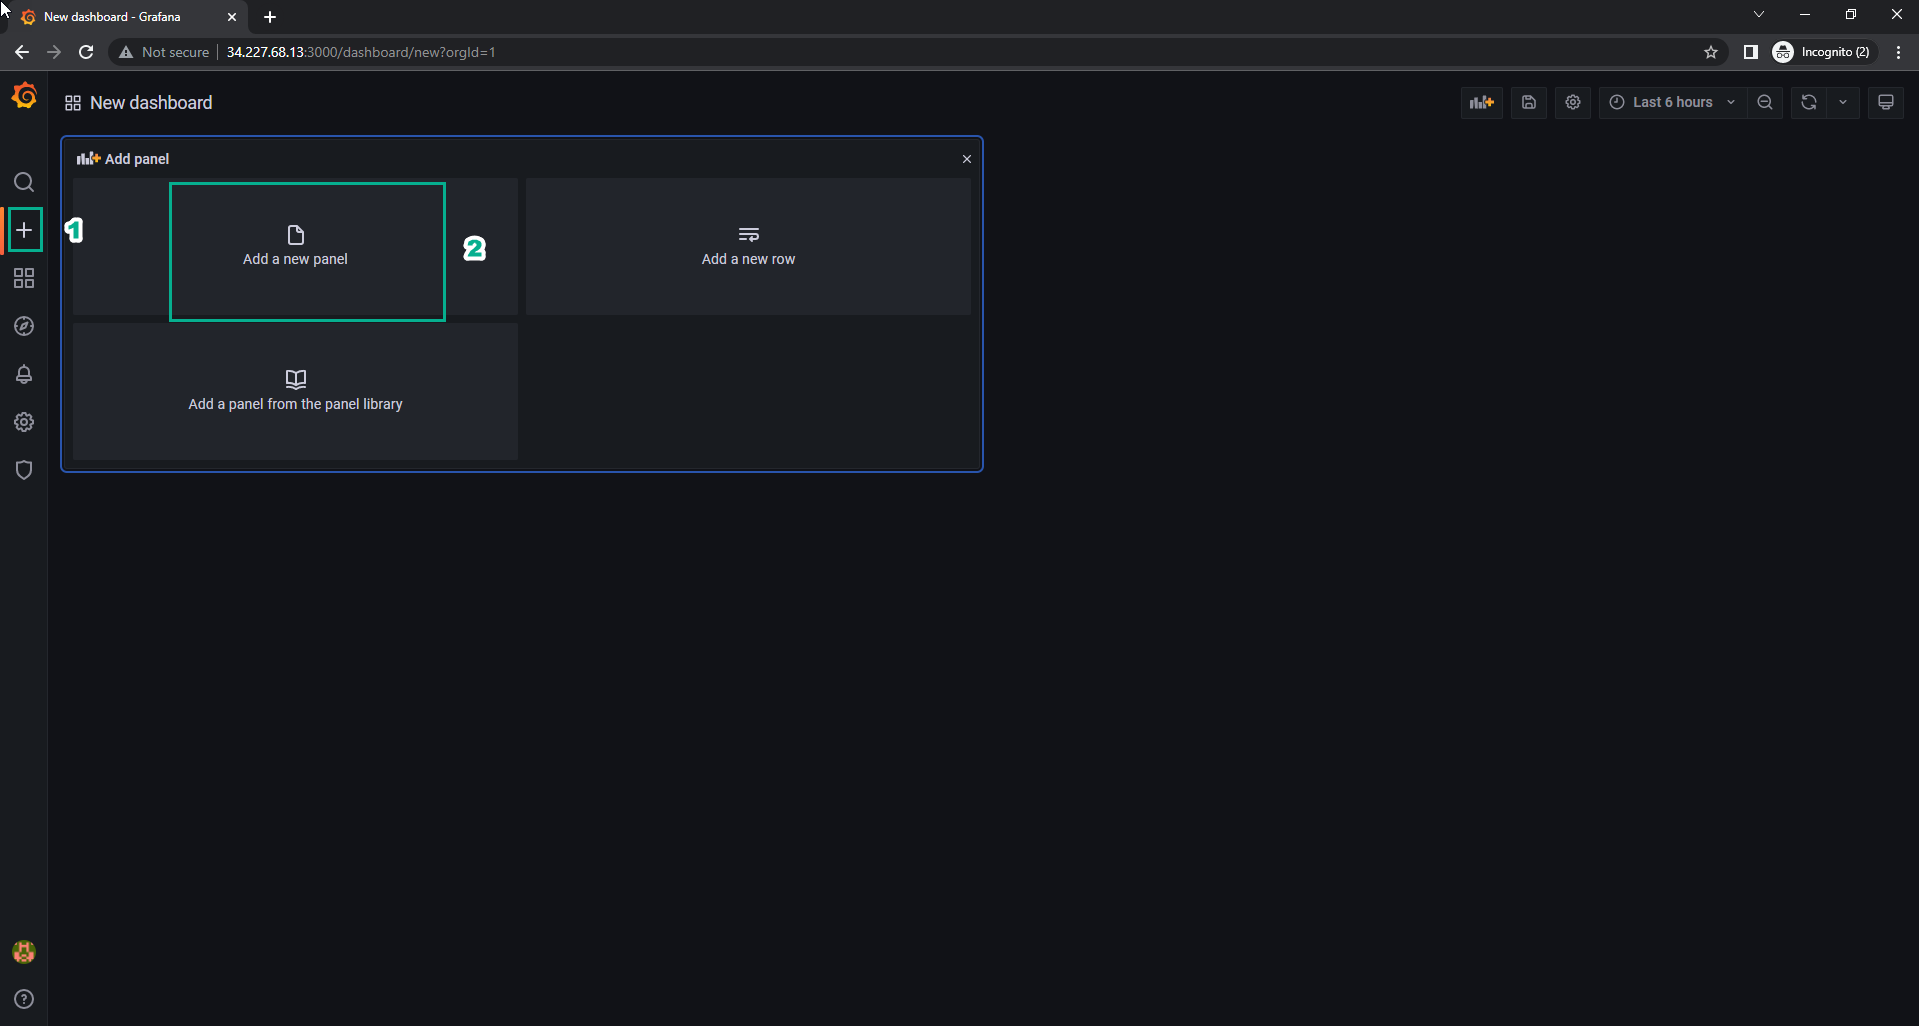
In the Grafana interface:
- Select Dashboard.
- Select Create Dashboard.
- Select Add Visualization.
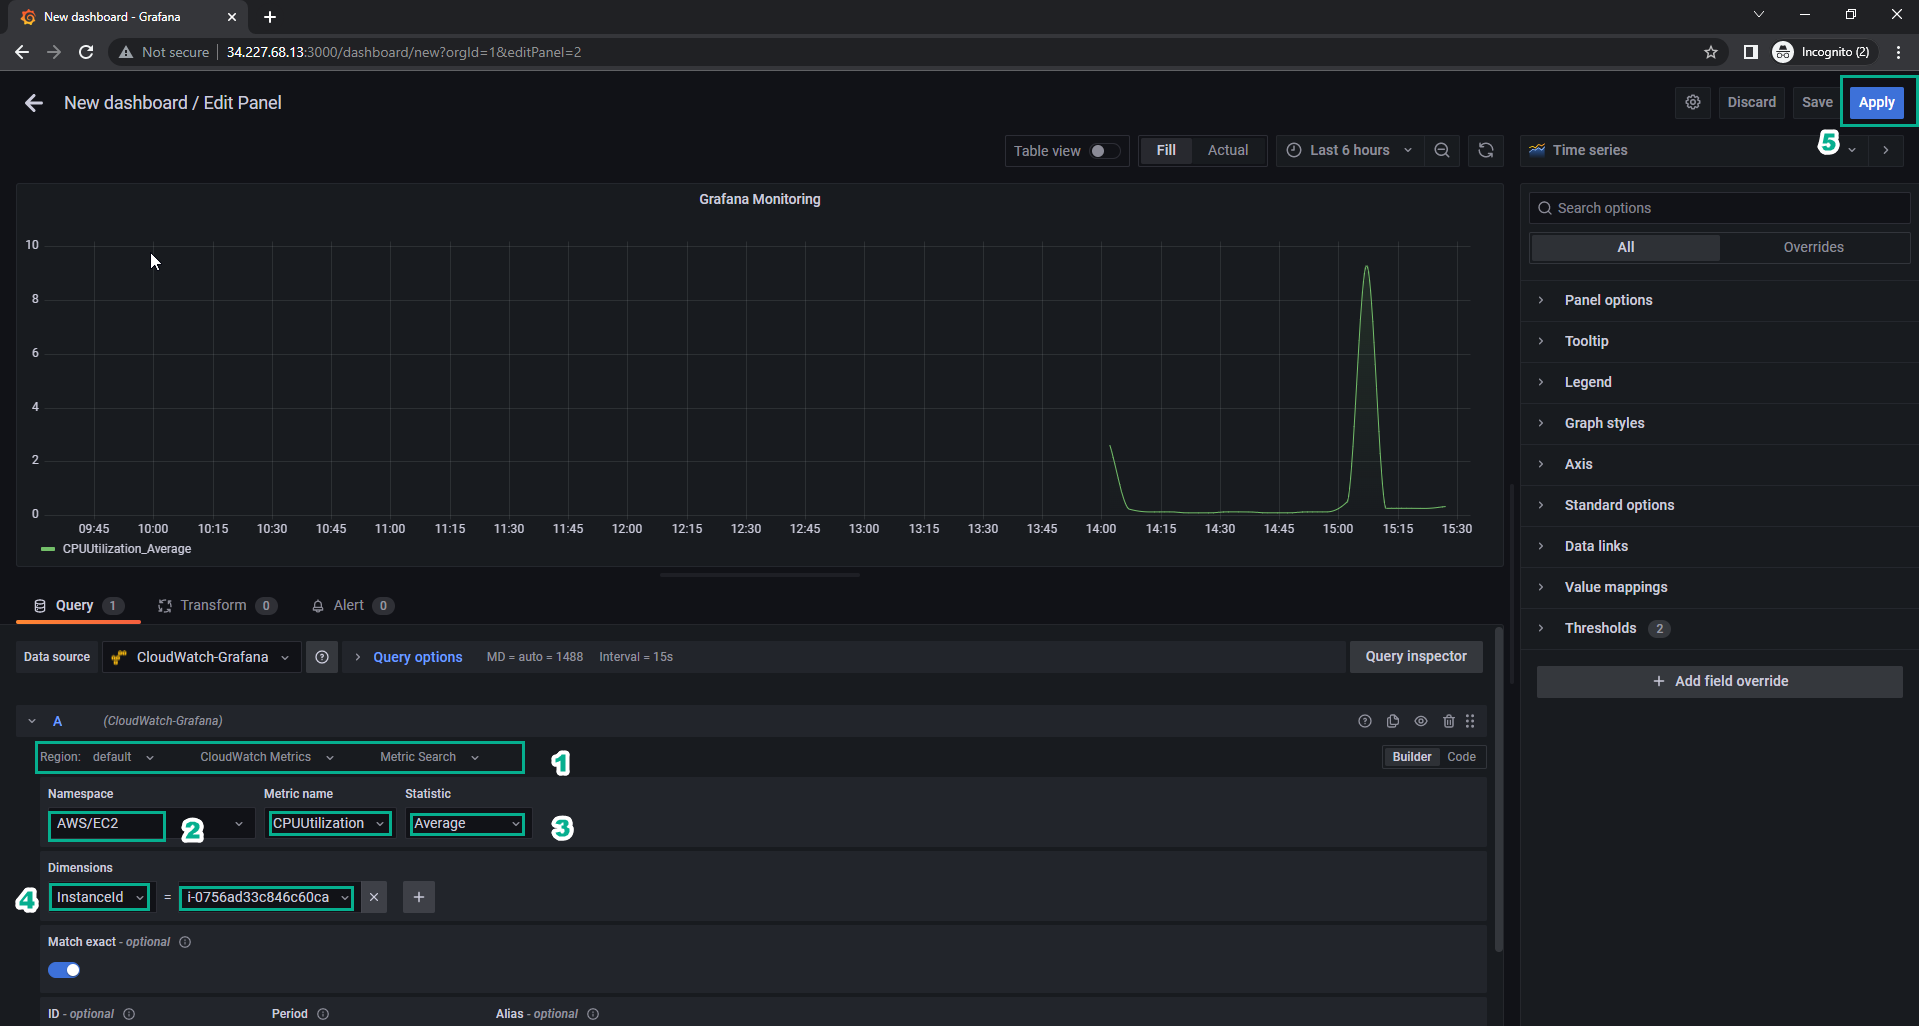
In the Visualization creation interface:
- Select data source as cloudwatch.
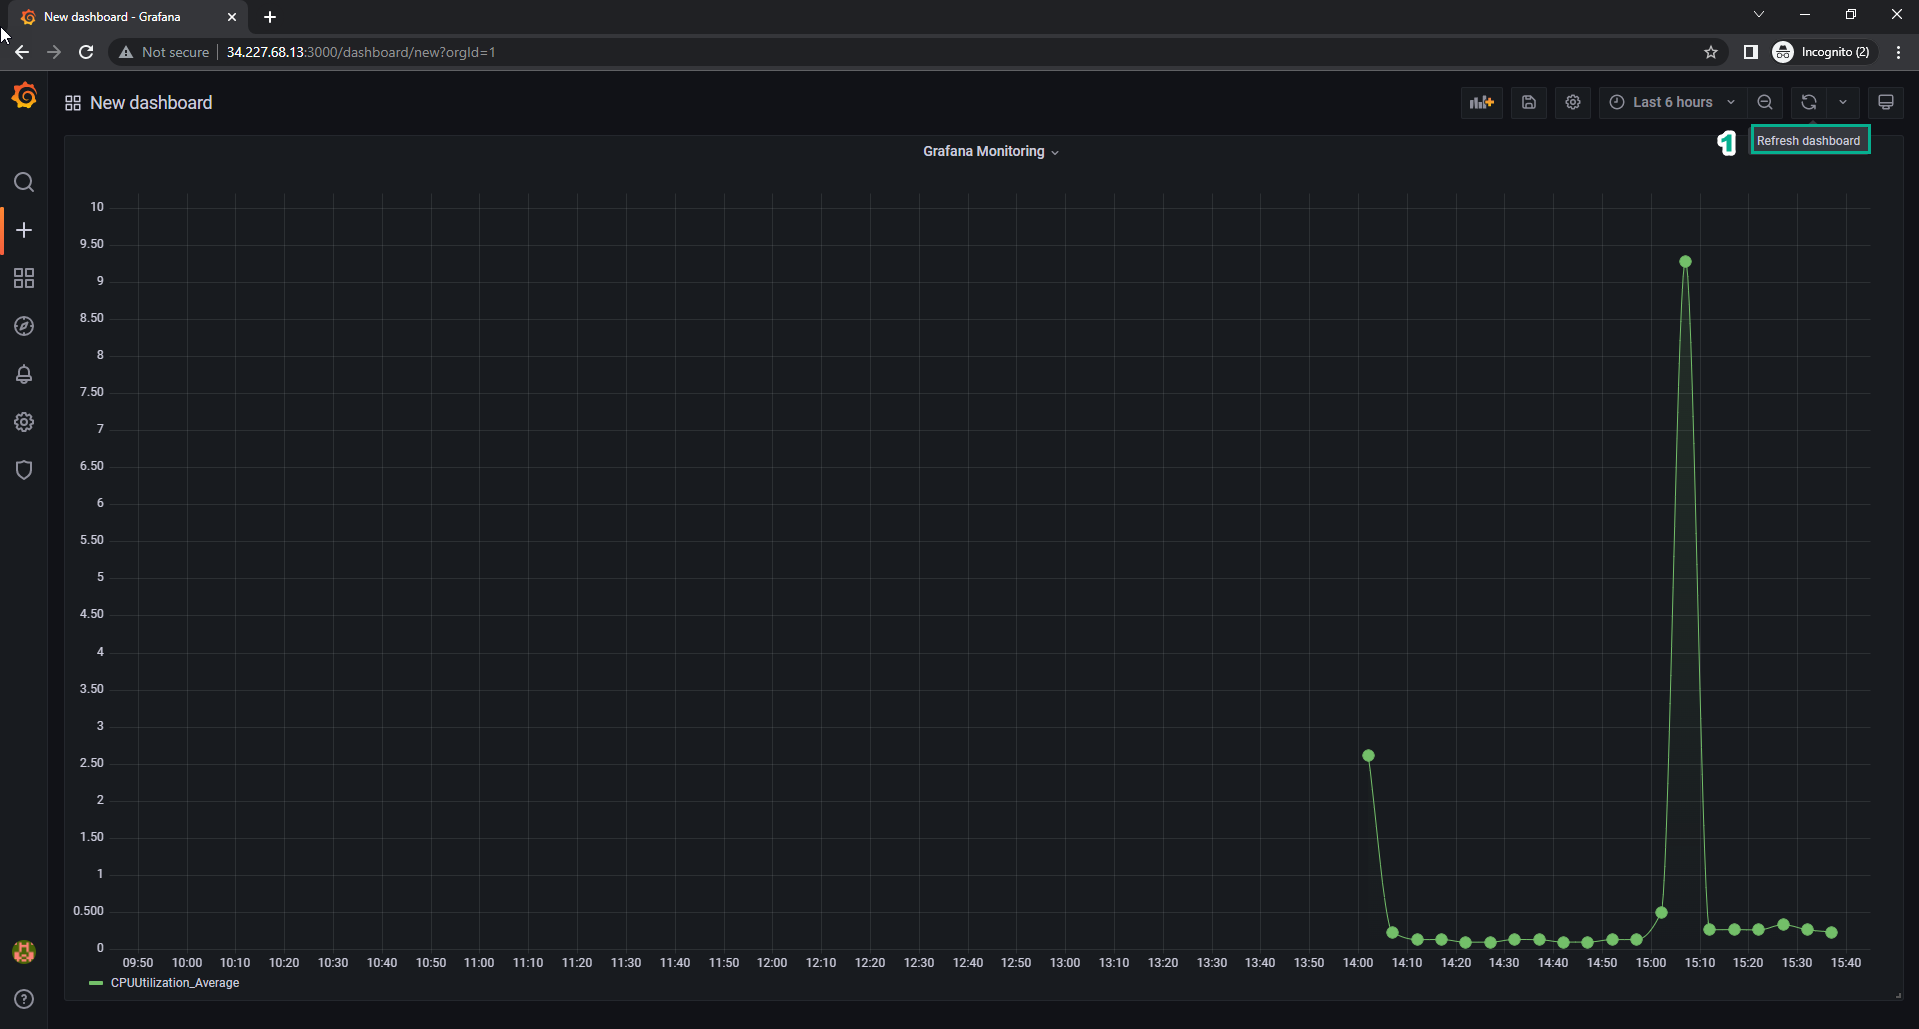
In the Query section:
- Select Region, choose ap-southeast-1.
- Select CloudWatch Metrics.
- Select Metric Search.
Select Namespace, choose AWS/EC2.
Select Metric name, choose CPUUtilization.
Select Statistic, choose Average.
Select Dimensions, choose InstanceId and enter the Instance ID of the Grafana-Server instance.
After configuration, select Run queries.
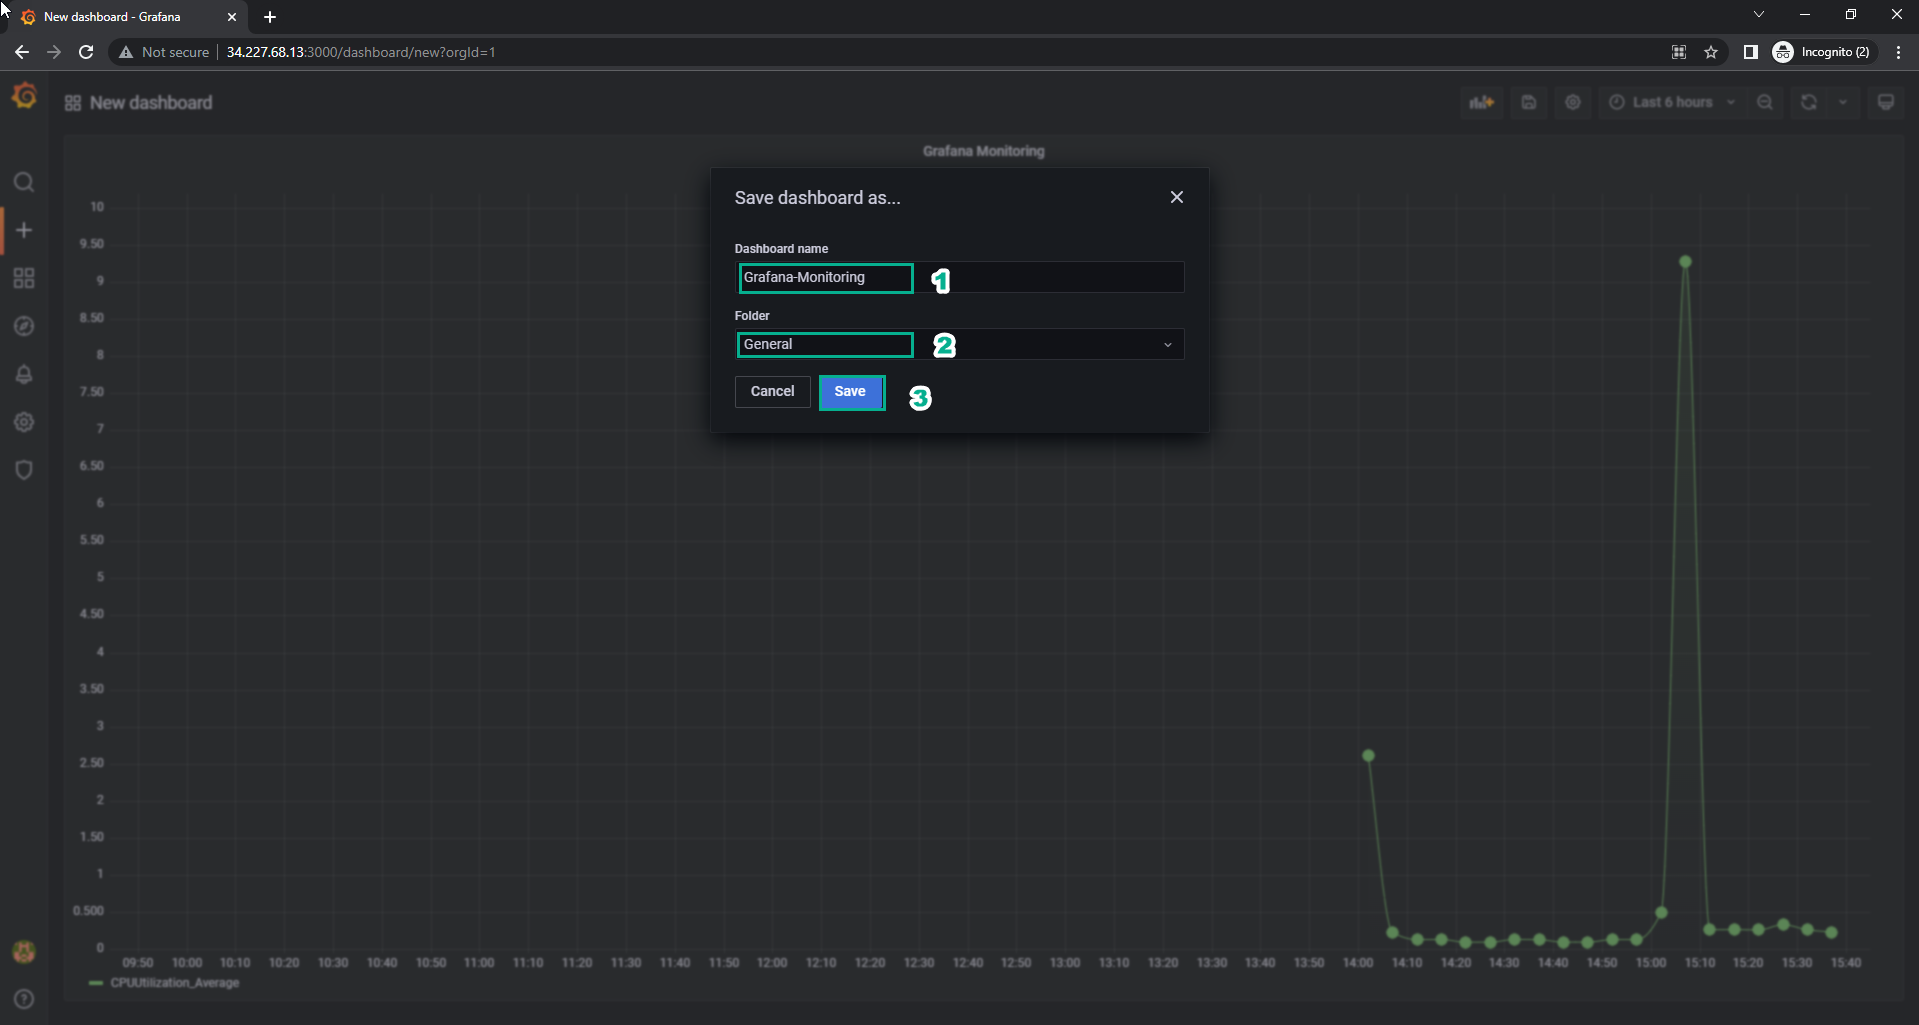
Note: If you cannot query with Statistic: Average, you can change Statistic to Sum or Maximum to query data.
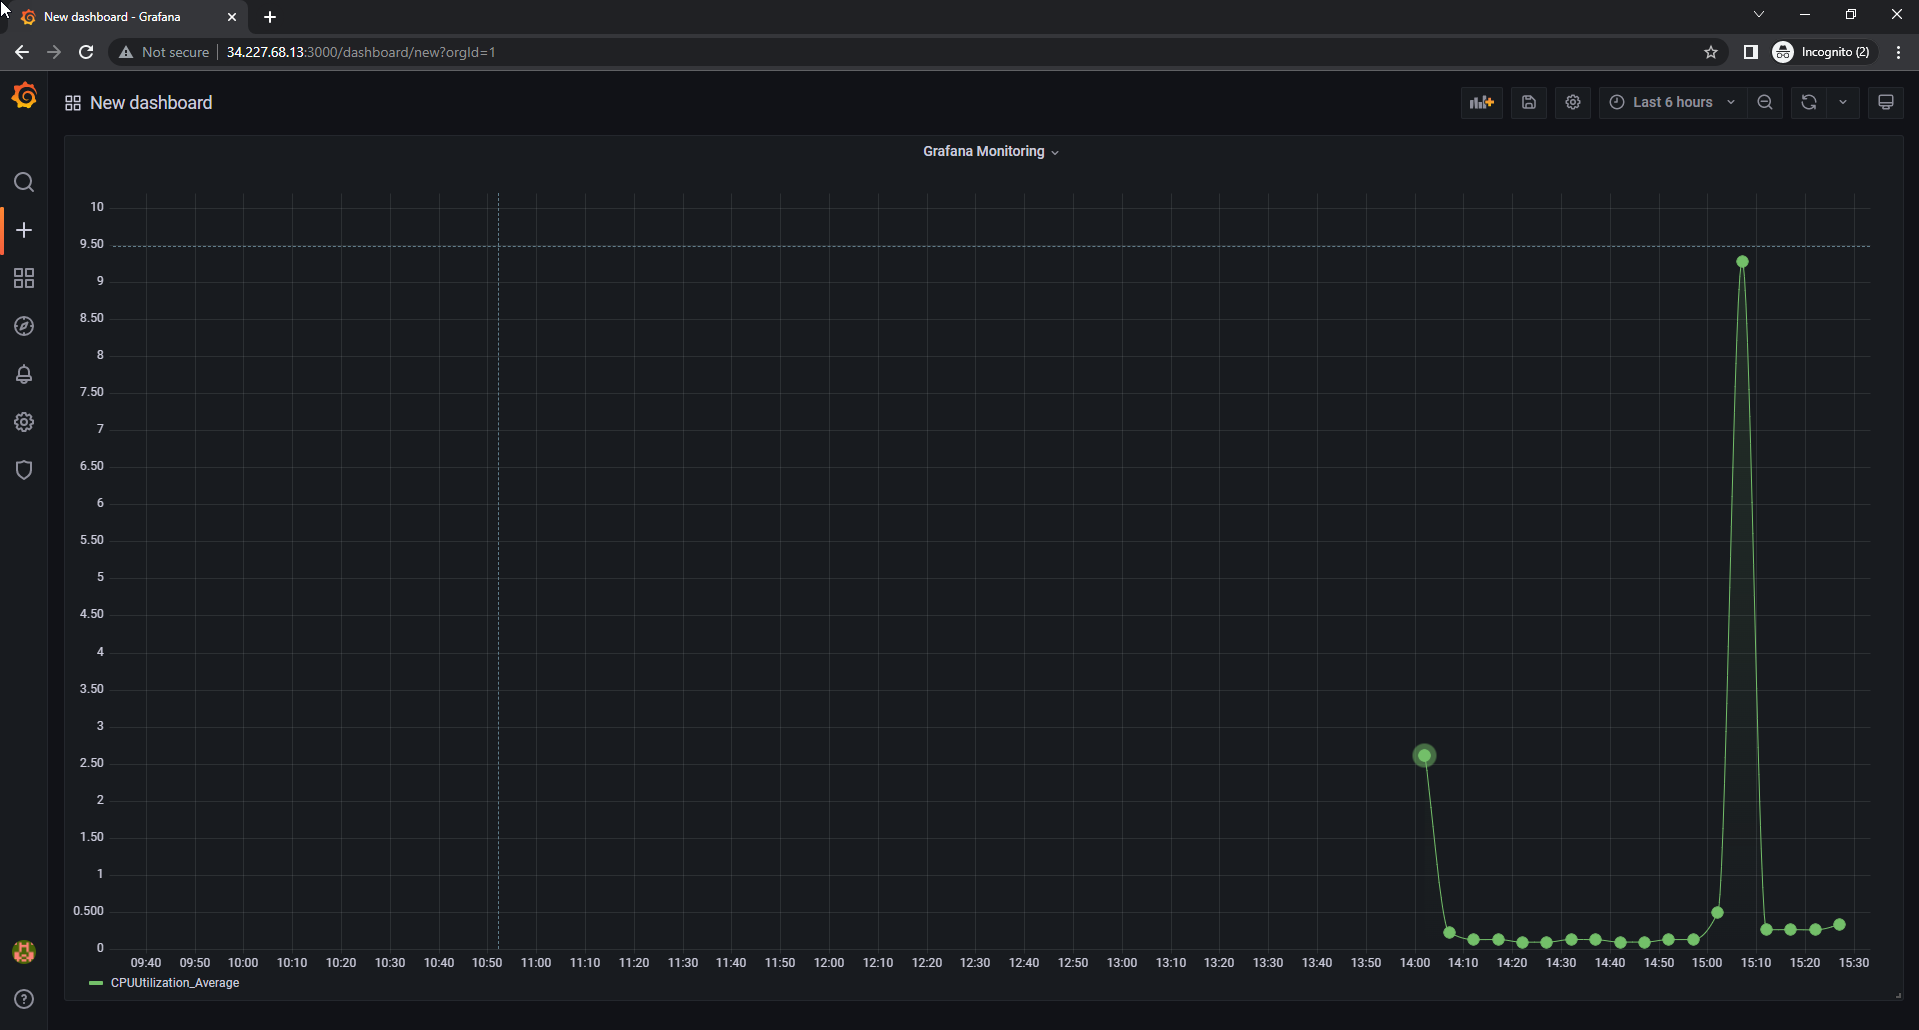
After executing the Query, the dashboard will display data according to your configuration.
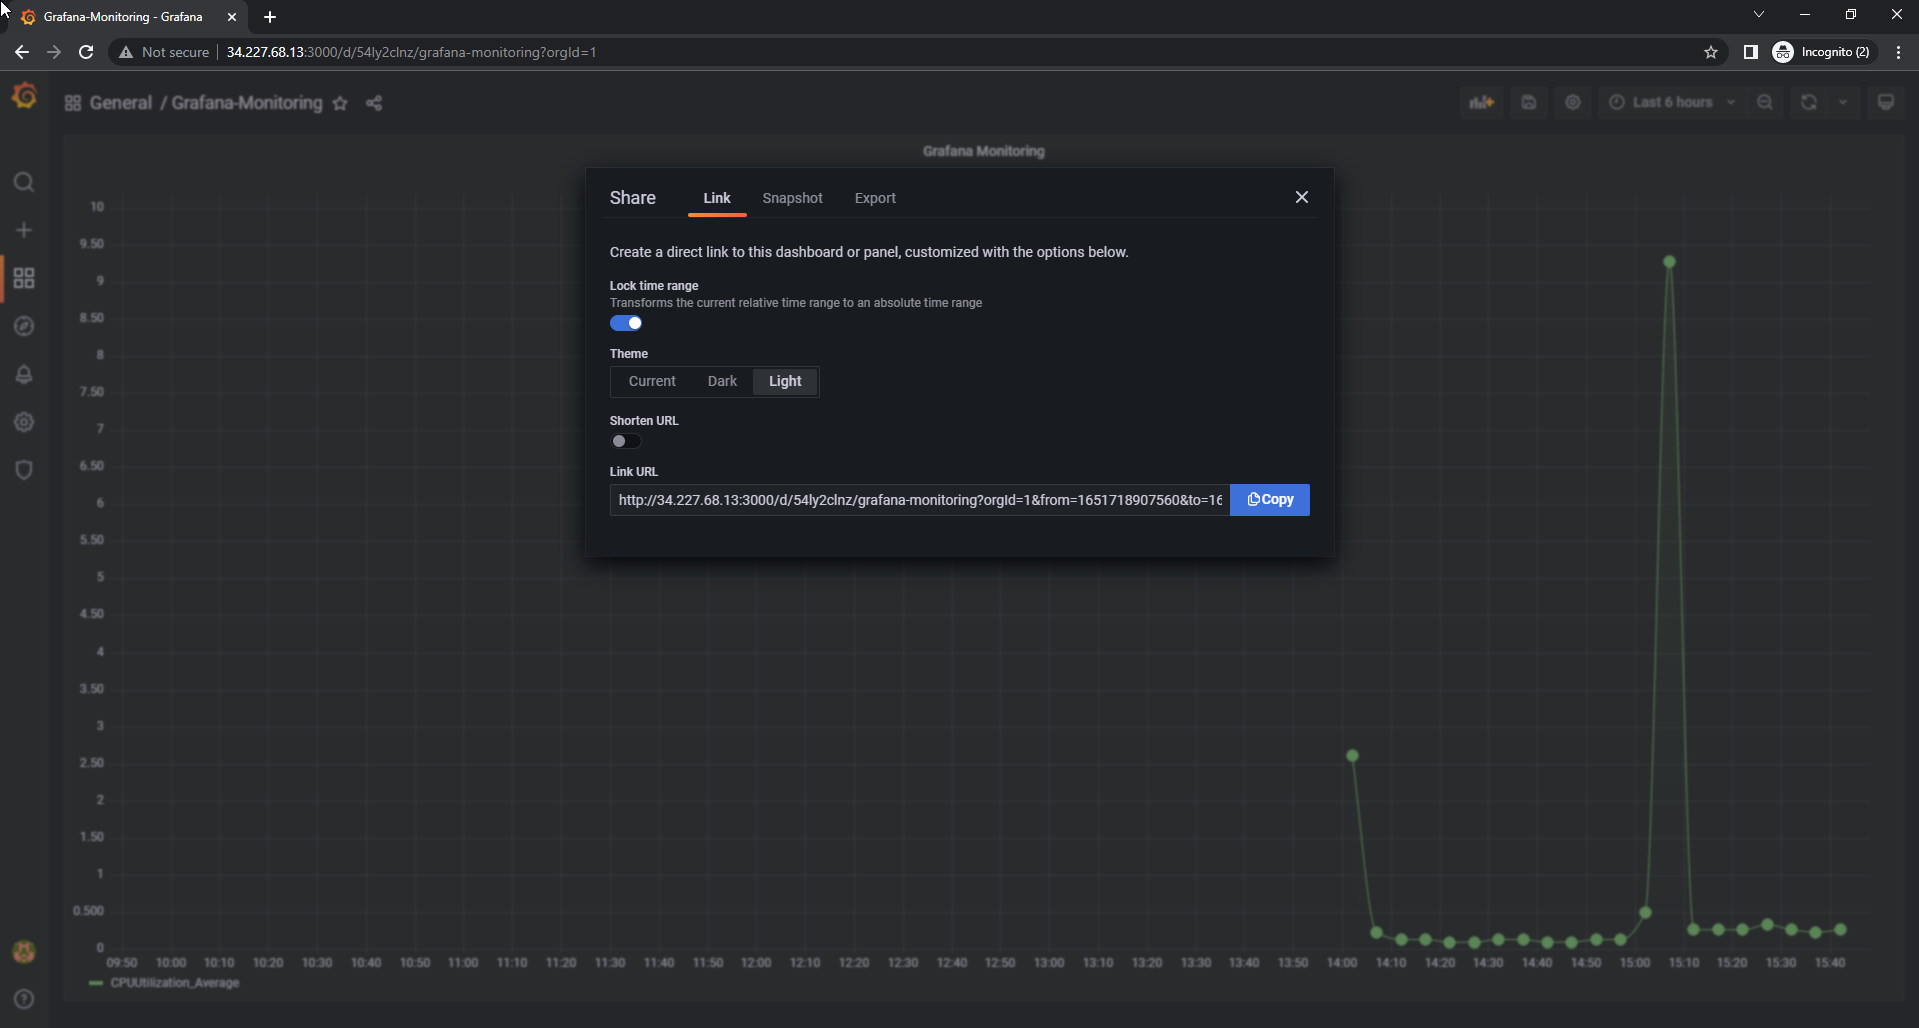
Save dashboard:
- In Dashboard name, enter
Grafana-Monitoring. - In Folder, select Dashboards.
- Select Save.
- In Dashboard name, enter
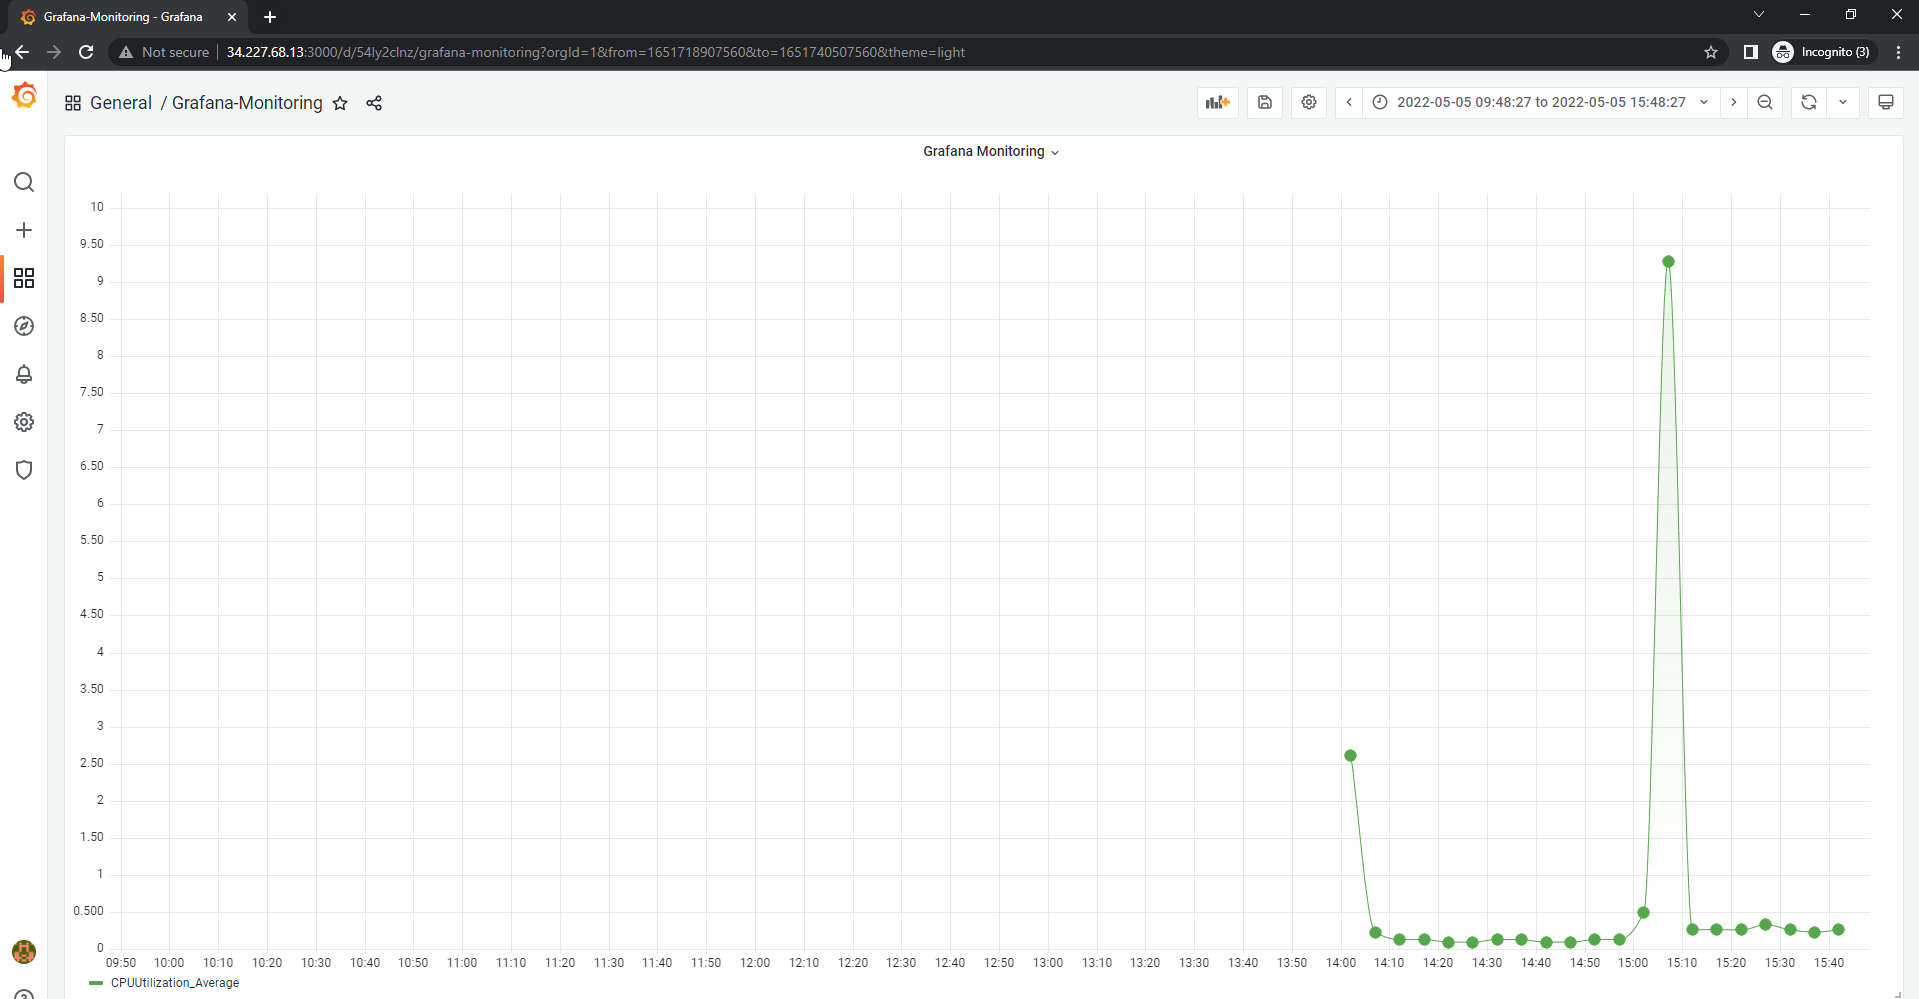
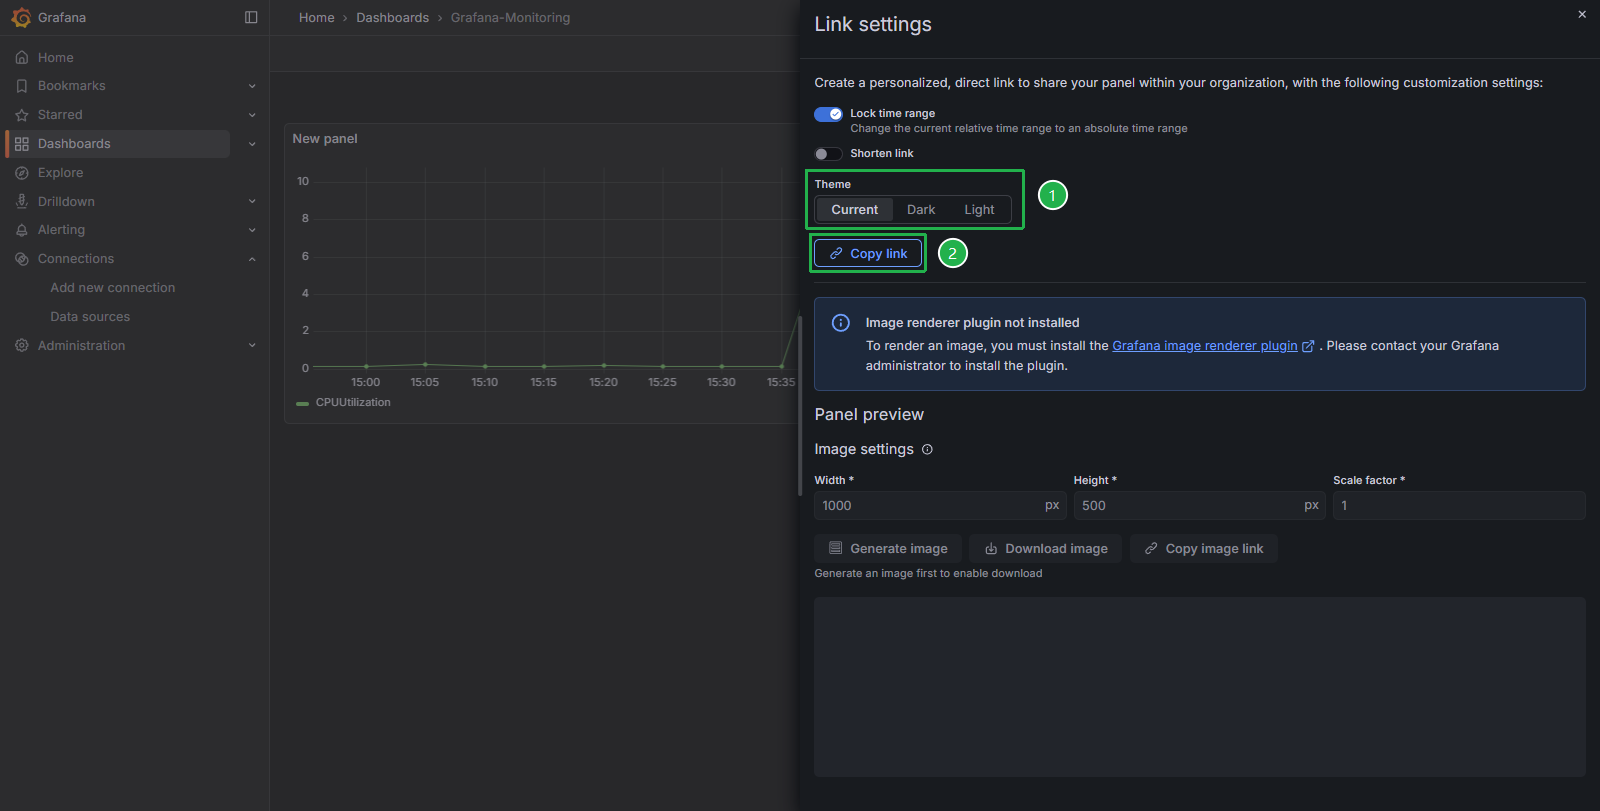
In the Dashboard section, you can select Share and copy the share link to share the dashboard with others.
- You can select theme as shown in the image.
Paste the share link into a new browser to view the dashboard.
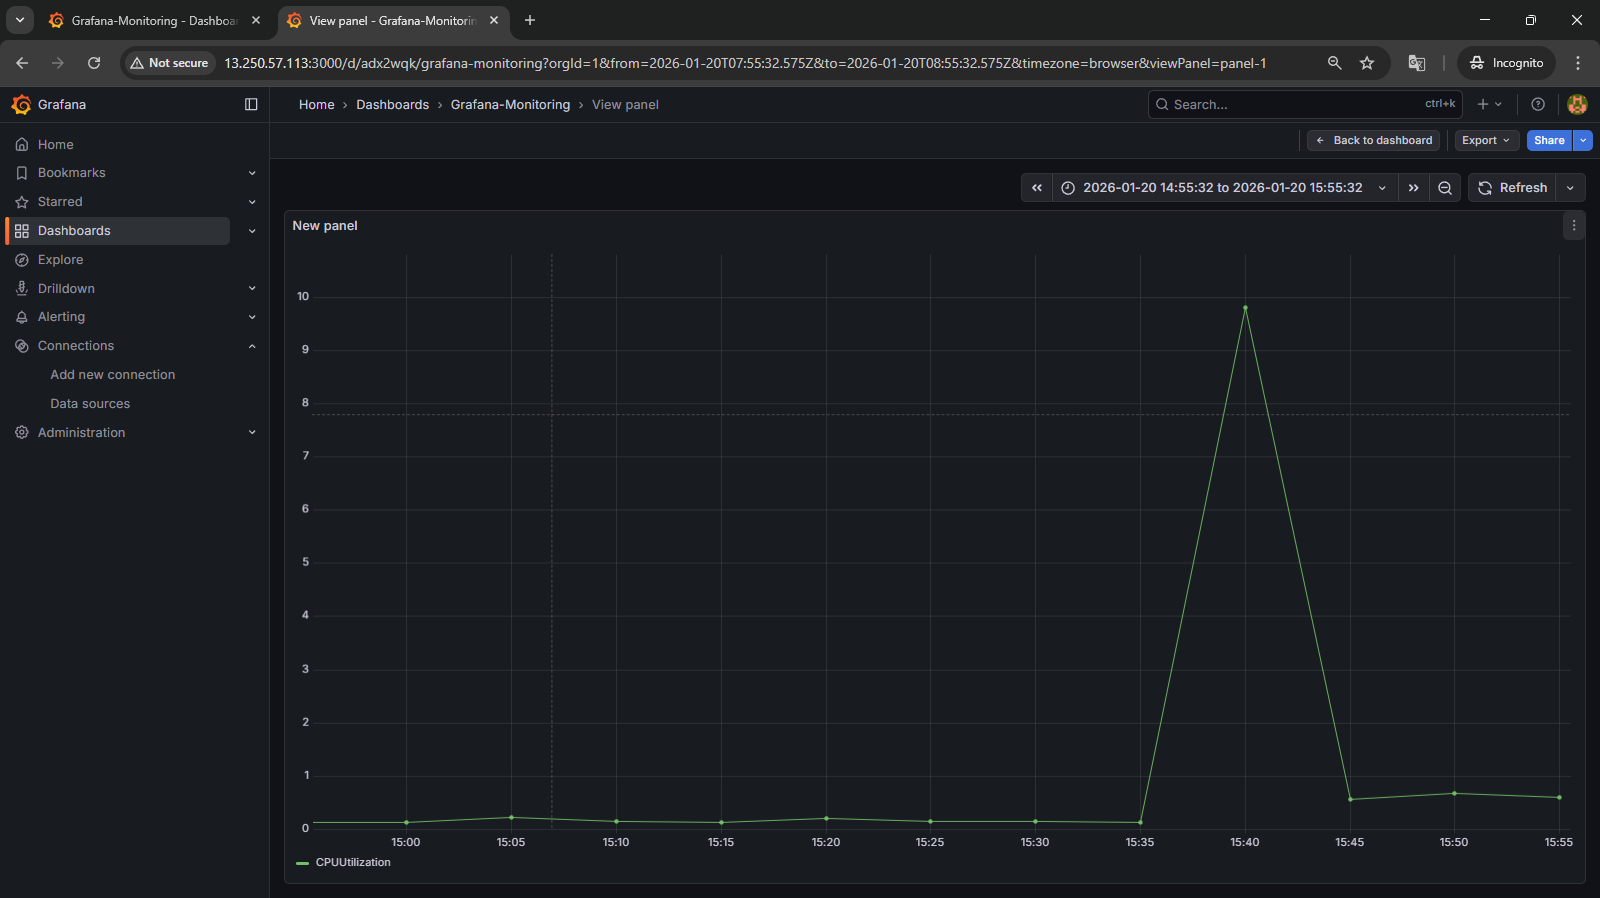
When copying the link, the URL will be in localhost format because Grafana uses the server’s local address by default. To view the dashboard externally, you need to replace localhost with the Public IPv4 address of the EC2 instance.
Executing Explore:
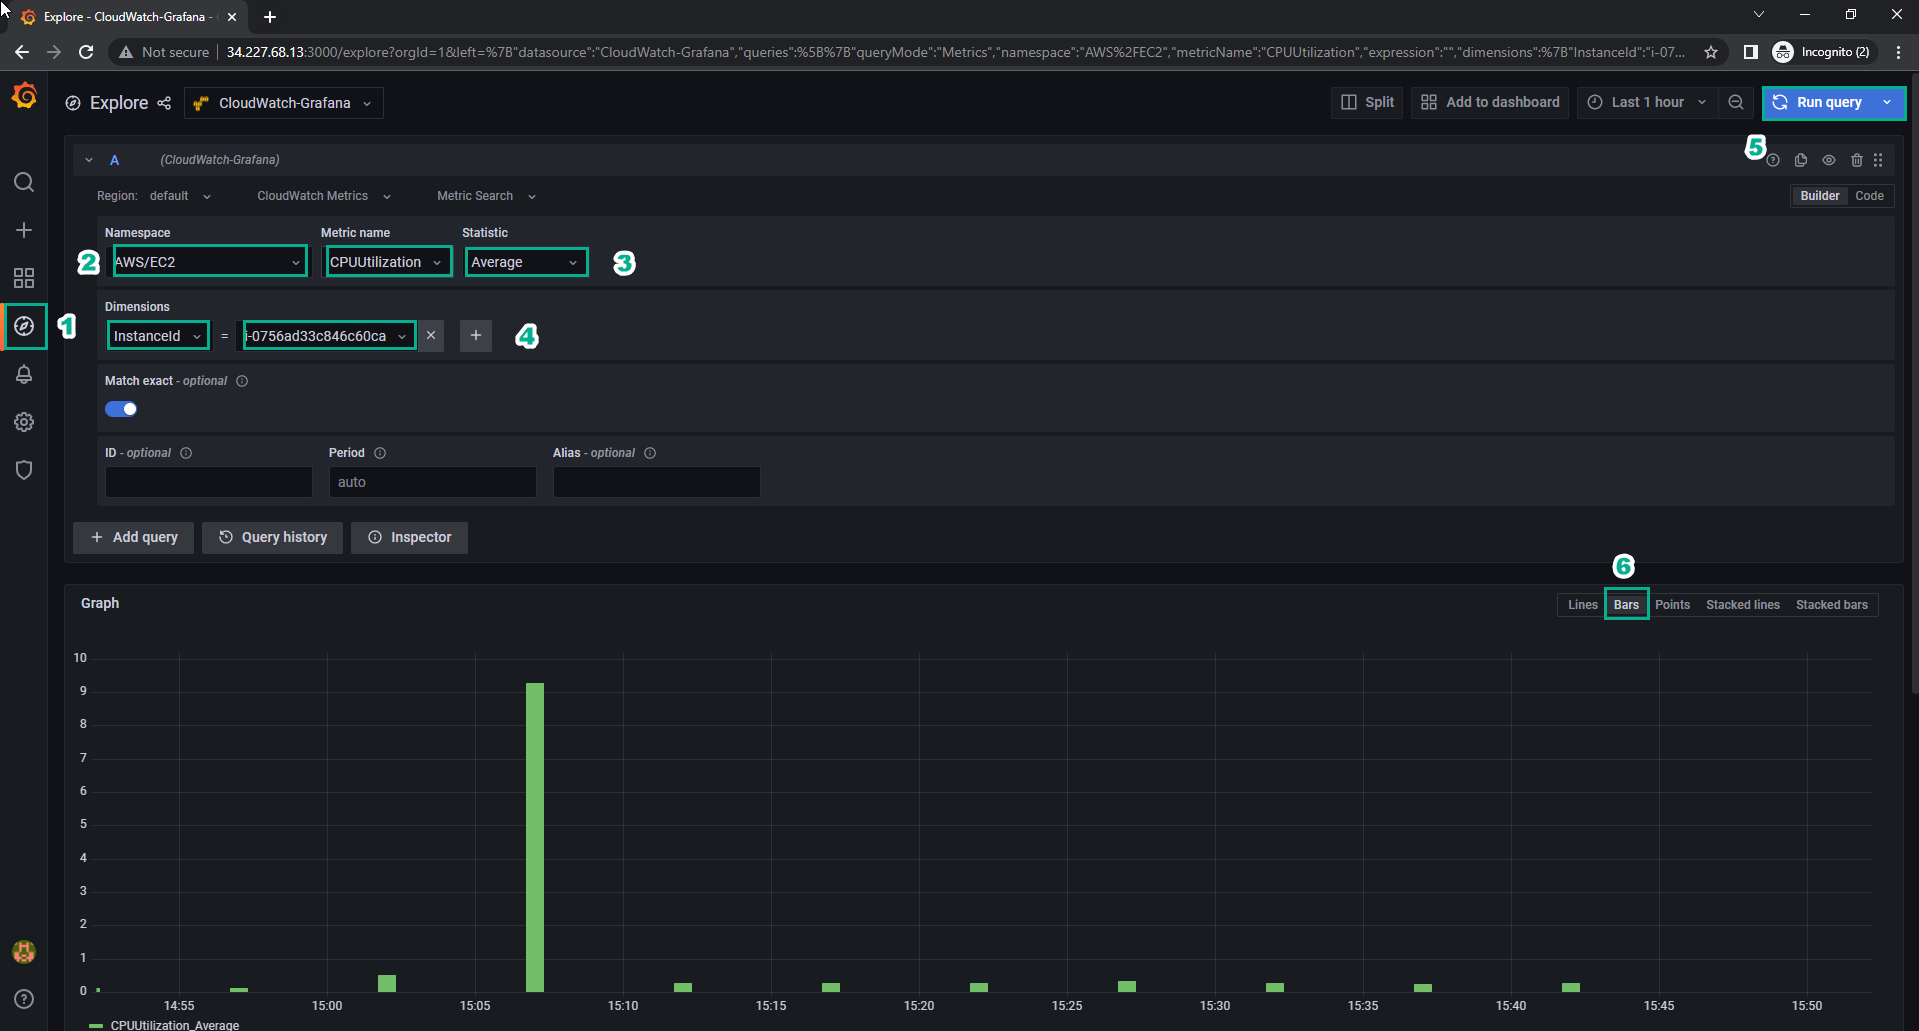
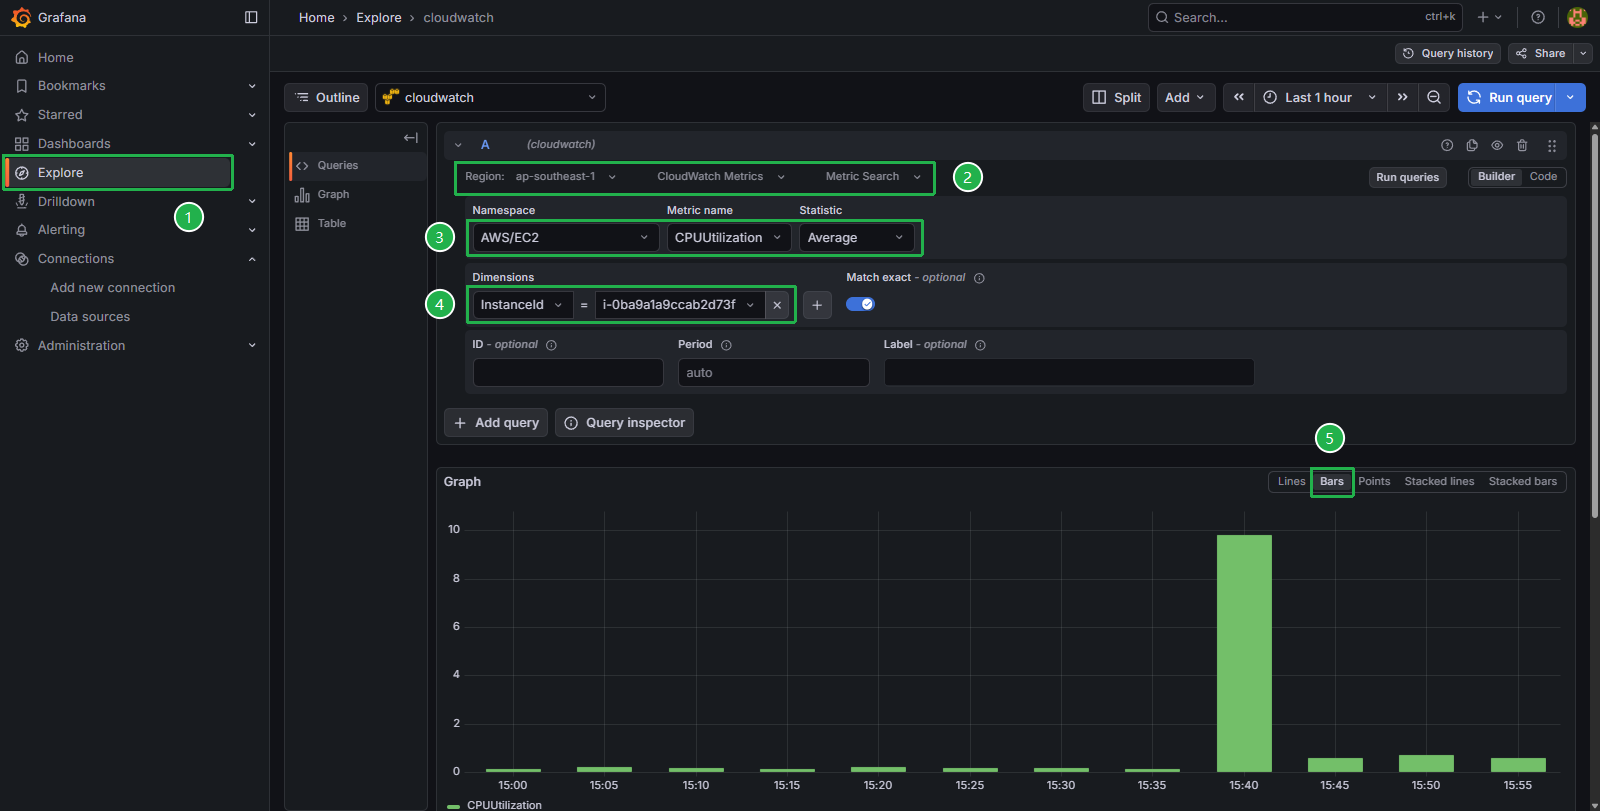
- In Namespace, select AWS/EC2.
- In Metric name, select CPUUtilization.
- In Statistic, select Average.
- In Dimensions, select InstanceID and enter the Instance ID of the Grafana-Server instance.
- Select Run query.
- Select Bars to view the chart.
Some Reference Sources
Below are some reference sources and notes for installing Grafana on an EC2 instance on AWS:
Grafana Official Website: The official Grafana website provides detailed documentation and support materials on how to install and use Grafana. You can learn more about installing Grafana on EC2 here: grafana.com/grafana
LinkedIn Post by Vinay Kumar: This post may contain specific instructions on how to install Grafana on an AWS EC2 instance. LinkedIn often has many posts from experts in this field. Vinay Kumar’s Post
AWS with Atiq Blog: This blog may share specific guides on installing and configuring Grafana on AWS. It’s a reference source that can provide advice and guidance from experienced individuals. AWS with Atiq Blog
Additionally, here are some important notes when installing Grafana on EC2:
Choose the appropriate EC2 instance type: Determine the EC2 instance type you want to use based on the requirements of your Grafana application. This may vary depending on the workload and resources you need.
Security: Always follow best security practices when installing Grafana, including ensuring strong password storage and secure authentication.
Data Backup: Ensure you have a data backup strategy for Grafana to avoid the loss of important data.
Data Sources Setup: Install and configure data sources (e.g., Prometheus, InfluxDB) for Grafana to be able to display and monitor data from different sources.
Maintenance Management: Ensure you understand how to manage and maintain your Grafana instance, including updates and system security.
Remember to proceed with care and refer to the reference sources to ensure a successful installation of Grafana on your EC2 instance.